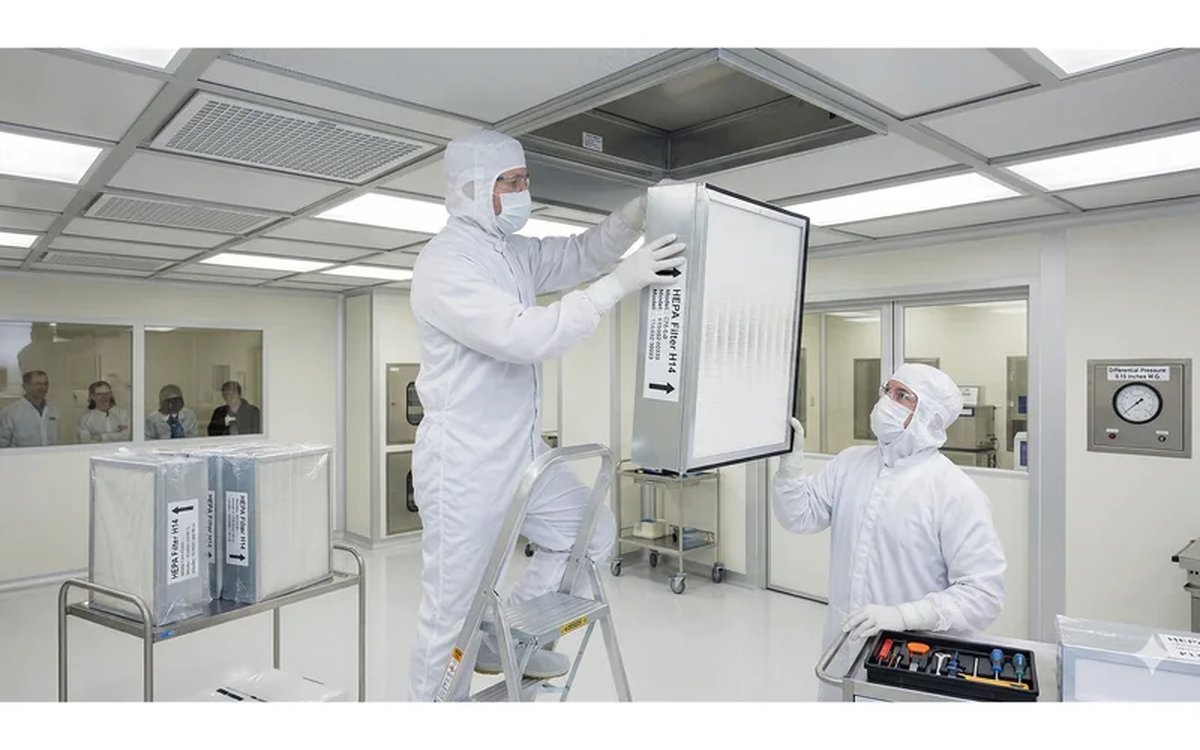
Swapping too early means wasted consumables and labor. Swapping too late means betting wafer or product yield on a tired filter. There's a middle point — a disciplined replacement strategy finds it.
Neither "On Schedule" nor "On Pressure Drop" Alone Is Enough
Two common approaches:
A. Time-based — swap every 5 years Pros: simple, easy to plan Cons: some filters have already failed, some are still healthy — a flat cadence wastes money
B. Pressure-drop-based — swap at 2× initial ΔP Pros: measurable Cons: some failures (local leaks, fiber displacement) don't increase ΔP but do leak particles
The disciplined approach runs all three triggers — any one hitting its threshold starts replacement.
Chart 1: Three Triggers for Filter Replacement
Any one of them alone is enough — don't wait for all three to arrive
Pressure drop
Cleanliness
Age
Install ΔP transducers on every FFU / AHU and hook them into central monitoring. Start replacement procurement at 80 % of the alarm threshold so you never wait on parts.
Trigger 1: Pressure Drop Hit
Threshold: HEPA / ULPA pressure drop reaches 2× initial, or absolute 450–600 Pa.
How to measure: install ΔP transducers on every FFU / AHU and tie them into central monitoring. Set a pre-alarm at 80 % of the replacement threshold to trigger procurement — so you never face the actual threshold without a spare in hand.
Practical note: growth rate varies with inlet dust load. Fabs near highways or industrial zones may hit threshold in 6 months; clean hospitals or offices might run 3 years. Don't apply an "average" to everyone — track each zone separately.
Trigger 2: Cleanliness Off
Threshold: particle count (OPC) anomalies, recurring or trending — even if ΔP is still fine.
How to measure: ISO 14644-3 mandates periodic particle count monitoring:
- ▸High-class zones (ISO Class 5 and below) → at least monthly scans
- ▸Normal zones → quarterly full-zone count
Interpretation:
- ▸Uniform drop in efficiency across the filter → media aging, approaching end-of-life
- ▸Localized spike at one point → filter leak (pinhole, seal degradation)
- ▸Rising trend over time → filter degrading; plan replacement before failure
Point: normal ΔP ≠ healthy filter. Leaks don't raise ΔP but do let particles through. ΔP alone misses leak failures.
Trigger 3: Age
Threshold: even with ΔP and particle count normal, HEPA filters should be replaced at 5–8 years; pre-filters (G4 primary, F7 medium) every 3–12 months by environment.
Why a time limit? Media ages:
- ▸Glass fiber weakens under acid, base, or humidity → becomes brittle
- ▸Binder degrades → fibers loosen
- ▸Seals harden and crack → loss of airtightness
An aged filter may fail suddenly under stress (pressure spike, temperature shift). 5+ years is time to replace HEPA.
The Most Underrated Cost-Saver: Rotate Pre-Filters
Many facilities "run pre-filters until they break" — and shorten HEPA life in the process.
Chart 2: Diligent Pre-Filter Swaps → HEPA Life Up ≥ 40 %
Cheapest leverage point in the whole filter-management strategy
Based on customer fleet averages. Actual uplift depends on inlet air quality and process. In dusty/salty outdoor environments, uplift can exceed 60 %.
Why do pre-filters matter so much to HEPA?
HEPA costs 10–30× a pre-filter. But HEPA is highly sensitive to coarse-particle loading — once coarse dust reaches it, ΔP climbs fast and media accelerates toward end-of-life.
Pre-filters are HEPA's goalkeepers. Diligent goalkeeping lets HEPA run much longer.
Measured result
Based on customer fleet tracking:
- ▸No pre-filter rotation → HEPA baseline life = 100 %
- ▸Pre-filter rotation on schedule → HEPA life = ≥ 140 %
- ▸A +40 % or more uplift
The math: assume HEPA costs $300/unit, pre-filter $30.
- ▸No pre-filter rotation: replace HEPA every 5 years = $60/year
- ▸Diligent pre-filter: pre-filter every 6 months = $60/year, HEPA now lasts 7 years = $43/year
Pre-filter adds $60/year, HEPA saves $17/year — looks like no win.
But that's only filter cost. Add:
- ▸HEPA replacement downtime (hours to days each)
- ▸HEPA disposal and logistics
- ▸Cleanliness recovery time during swap, which blocks production
Total TCO usually drops 20–30 %.
Three Management Actions
- 1Install ΔP transducers into central monitoring — every FFU / AHU. Don't rely on periodic walk-through readings
- 2Maintain a replacement logbook — install date, cumulative runtime, ΔP history, particle-test results per filter
- 3Run quarterly trend review — spot zones where ΔP or counts climb faster; rework pre-filter rotation or monitoring cadence
Filter management isn't "replace by calendar" or "wait until it breaks." Run all three indicators — pressure drop, cleanliness, age — and act on the first one that hits. That's the strategy that controls both cost and cleanliness over the long run.